Analyzing Test Response Patterns with IRT

Psychometrics
Item Response Theory
Tutorial
Author

Hansol Lee

Published

December 15, 2024

Introduction

Item Response Theory (IRT) is widely used in psychometrics to model the relationship between an individual’s latent ability and their responses to test items. In this post, I’ll walk through a basic example of fitting an IRT model to simulated data and visualizing item characteristics.

Simulated Data

We’ll generate simulated test response data for 200 respondents and 10 items using the mirt package in R.

# Simulate item response data
library(mirt)
Loading required package: stats4
Loading required package: lattice
set.seed(123)
n_items <- 10
n_people <- 200
sim_data <- simdata(a = rep(1, n_items), d = seq(-2, 2, length.out = n_items), N = n_people, itemtype = "2PL")
head(sim_data)
     Item_1 Item_2 Item_3 Item_4 Item_5 Item_6 Item_7 Item_8 Item_9 Item_10
[1,]      1      0      0      0      1      0      1      0      0       1
[2,]      0      0      0      0      1      0      0      1      0       1
[3,]      1      0      0      0      1      0      1      1      1       1
[4,]      0      0      0      1      1      1      1      1      1       0
[5,]      0      0      0      1      0      0      1      1      1       1
[6,]      0      1      1      1      1      1      0      0      1       1

Fitting an IRT Model

Next, we’ll fit a 2-parameter logistic (2PL) IRT model to the simulated data.

# Fit a 2PL model
mod <- mirt(sim_data, 1, itemtype = "2PL")

Iteration: 1, Log-Lik: -1091.218, Max-Change: 0.28407
Iteration: 2, Log-Lik: -1087.773, Max-Change: 0.18593
Iteration: 3, Log-Lik: -1086.693, Max-Change: 0.11756
Iteration: 4, Log-Lik: -1086.171, Max-Change: 0.05072
Iteration: 5, Log-Lik: -1086.110, Max-Change: 0.03394
Iteration: 6, Log-Lik: -1086.085, Max-Change: 0.02389
Iteration: 7, Log-Lik: -1086.067, Max-Change: 0.00888
Iteration: 8, Log-Lik: -1086.065, Max-Change: 0.00652
Iteration: 9, Log-Lik: -1086.065, Max-Change: 0.00449
Iteration: 10, Log-Lik: -1086.064, Max-Change: 0.00251
Iteration: 11, Log-Lik: -1086.064, Max-Change: 0.00158
Iteration: 12, Log-Lik: -1086.064, Max-Change: 0.00124
Iteration: 13, Log-Lik: -1086.063, Max-Change: 0.00051
Iteration: 14, Log-Lik: -1086.063, Max-Change: 0.00029
Iteration: 15, Log-Lik: -1086.063, Max-Change: 0.00032
Iteration: 16, Log-Lik: -1086.063, Max-Change: 0.00027
Iteration: 17, Log-Lik: -1086.063, Max-Change: 0.00024
Iteration: 18, Log-Lik: -1086.063, Max-Change: 0.00021
Iteration: 19, Log-Lik: -1086.063, Max-Change: 0.00016
Iteration: 20, Log-Lik: -1086.063, Max-Change: 0.00014
Iteration: 21, Log-Lik: -1086.063, Max-Change: 0.00013
Iteration: 22, Log-Lik: -1086.063, Max-Change: 0.00011
Iteration: 23, Log-Lik: -1086.063, Max-Change: 0.00010
summary(mod)
           F1    h2
Item_1  0.614 0.377
Item_2  0.445 0.198
Item_3  0.527 0.278
Item_4  0.463 0.214
Item_5  0.490 0.240
Item_6  0.392 0.154
Item_7  0.405 0.164
Item_8  0.613 0.376
Item_9  0.702 0.492
Item_10 0.381 0.145

SS loadings:  2.639 
Proportion Var:  0.264 

Factor correlations: 

   F1
F1  1

Visualizing Item Characteristic Curves

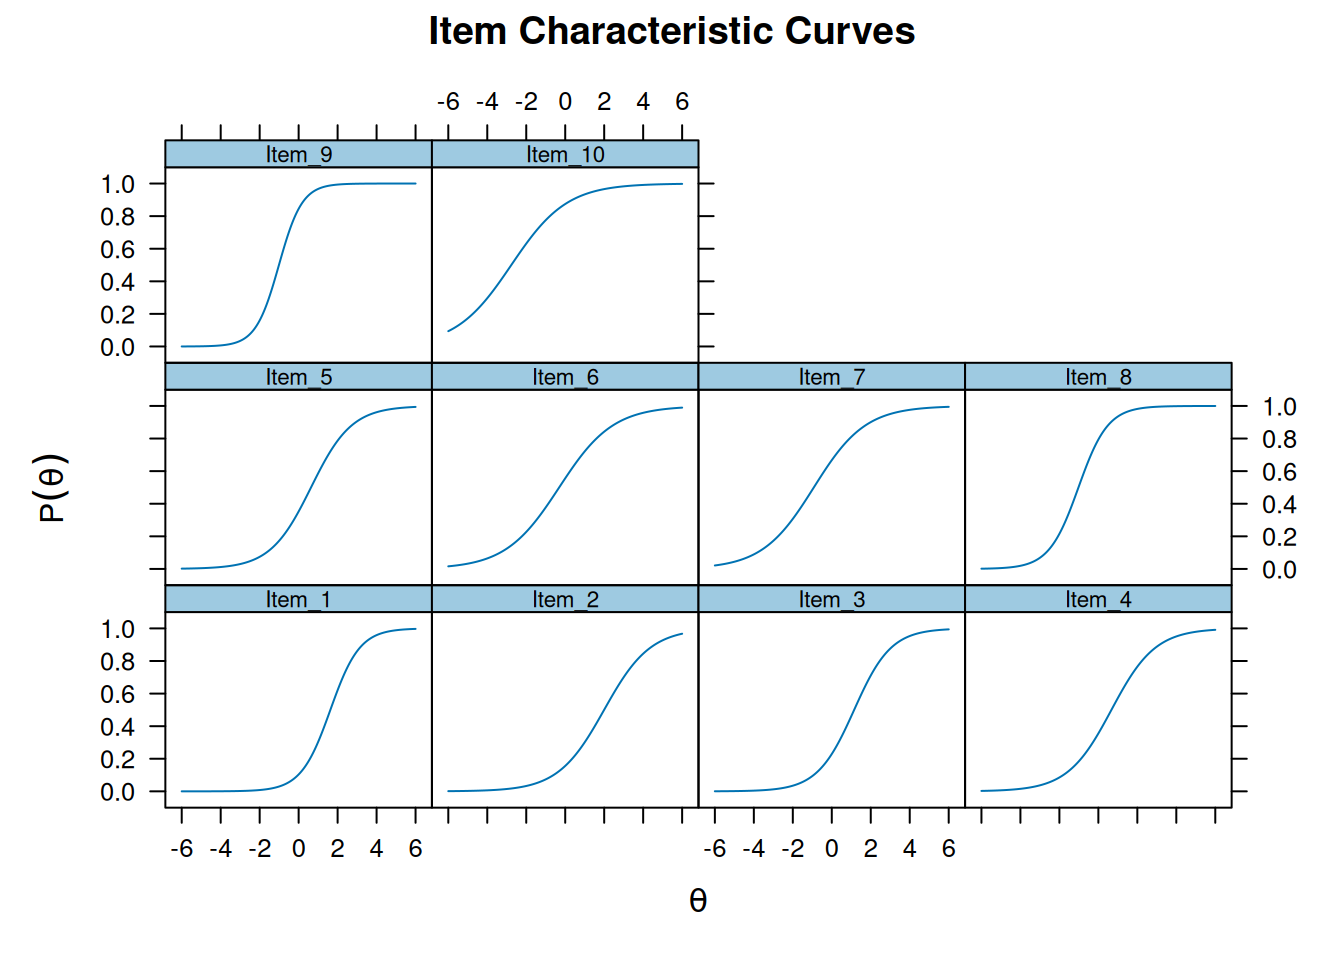
Item characteristic curves (ICCs) show the probability of a correct response as a function of latent ability. Let’s plot the ICCs for our items.

Visualizing Test Information

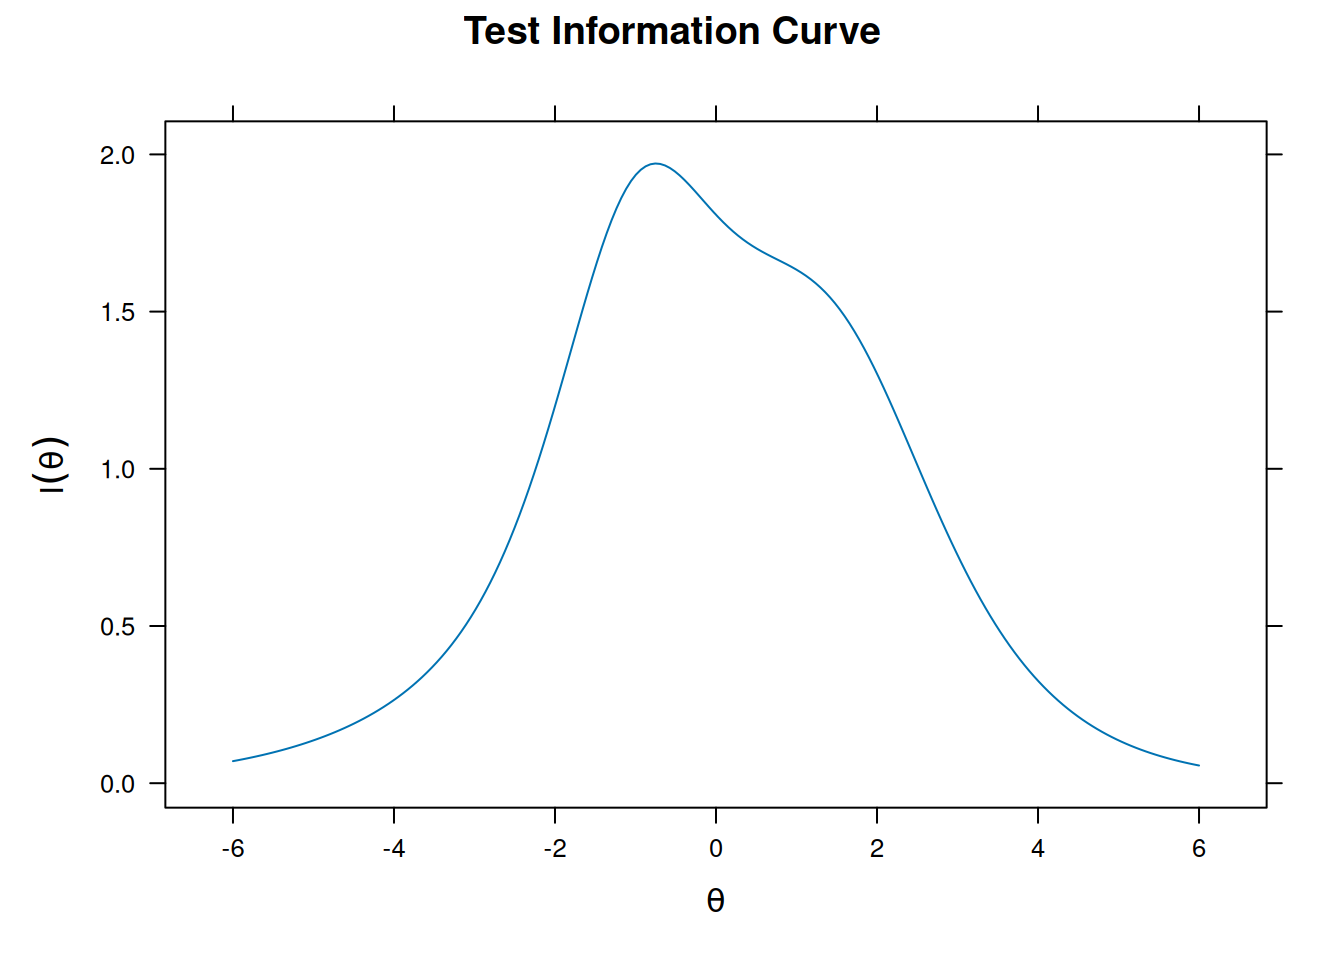
The test information curve shows how much information the test provides across different levels of ability. Let’s visualize this next.

Insights

From these analyses, we can observe:

  • Item Difficulty: Items with higher difficulty thresholds are more informative at higher ability levels.

  • Test Information: The test provides the most information for respondents with abilities around 0, which aligns with the range of item difficulties.

This example demonstrates how IRT can be used to evaluate test items and understand the relationship between ability and response patterns.

Conclusion

IRT is a powerful tool for understanding test performance and optimizing assessments. Future posts will dive deeper into differential item functioning (DIF) and other advanced topics in psychometric analysis.